How to create a Dashboard from Gravity Form entries
Gravity Forms offers a number of methods for extracting data.
In this example, we will :
- Create a Widget for your WordPress backend
- Extract the records from Gravity Form #3
- Calculate the number of reservations (form entries) and the number of people (the sum of field 17) over 6 months
- Display the results in a chart generated with chart.js
Add this code to your mu-plugin file:
<?php
/**
 * Add the Booking Statistics Widget
*/
add_action('wp_dashboard_setup', 'wpster_stats_widget');
function wpster_stats_widget() {
  wp_add_dashboard_widget('custom_stats_widget', 'Statistiques des réservations du restaurant sur 6 mois','custom_stats_widget');
}
function custom_stats_widget() {
	echo '<table>';
	// START PARAMETERS
	$month_limit = 6;
	$form_id = 3;
	$paging = array( 'offset' => 0, 'page_size' => 9999999 );
	// END PARAMETERS

	$total_booking = 0;
	$total_people = 0;
	$array_dates = array();
	$array_labels = array();
	$labels = '';
	$booking = '';
	$people = '';

	for ($i = 0; $i < $month_limit; $i++):
		$year = date('Y', strtotime('-'.$i.' month'));
		$month = date('m', strtotime('-'.$i.' month'));
		$array_labels[] = $month.'.'.$year;
		$array_dates[] = date('Y-m', strtotime('-'.$i.' month'));
	endfor;
	krsort($array_labels);
	krsort($array_dates);

	foreach($array_labels as $date) $labels.= "'$date',";

	foreach($array_dates as $date):
		$count = 0;
		$search_criteria = array(
			'status'        => 'active',
			'field_filters' => array(
			'mode' => 'any',
				array(
					'key'   => 'date_created',
					'value' => $date.'%',
					'operator' => 'like'
				),
			)
		);
		$entry_count = GFAPI::count_entries($form_id, $search_criteria, $sorting = null, $paging);
		$result = GFAPI::get_entries( $form_id, $search_criteria, $sorting = null, $paging);
		foreach($result as $key=>$value):
			if(is_numeric($value[17])) $count+=$value[17];
		endforeach;
		if($entry_count>0) :
			$booking.= $entry_count.',';
			$total_booking+=$entry_count;
			$people.= $count.',';
			$total_people+=$count*1;
		endif;
	endforeach;

	?>

	<div><canvas id="myChartLine"></canvas></div>
	<script src="https://cdn.jsdelivr.net/npm/chart.js"></script>
	<script>
		const ctxLine = document.getElementById('myChartLine');
		new Chart(ctxLine, {
			type: 'line',
			data: {
				labels: [<?php echo $labels; ?>],
				datasets: [{
					label: 'Nombre de réservations ',
					data: [<?php echo $booking; ?>],
					borderWidth: 1,
					tension: 0.5
				},
				{
					label: 'Nombre de places réservées ',
					data: [<?php echo $people; ?>],
					borderWidth: 1,
					tension: 0.5
				},
				]
			},
			options: {
				interaction: {
						mode: 'index',
						axis: 'y'
				},
				scales: {
					y: {
						beginAtZero: true
					},
				},
				plugins: {
					legend: {
						position: 'bottom'
					}
				},
			}
		});
	</script>

<?php
	echo '<p><strong>'.number_format($total_booking, 0, '.', '\'').'</strong> réservations ont généré ';
	echo '<strong>'.number_format($total_people, 0, '.', '\'').'</strong> places réservées.</p>';
	echo '<p><strong>Moyenne mensuelle : ';
	echo number_format($total_people/$month_limit, 0, '.', '\'');
	echo '</strong> places réservées.</p>';
	echo '</table>';
}


?>
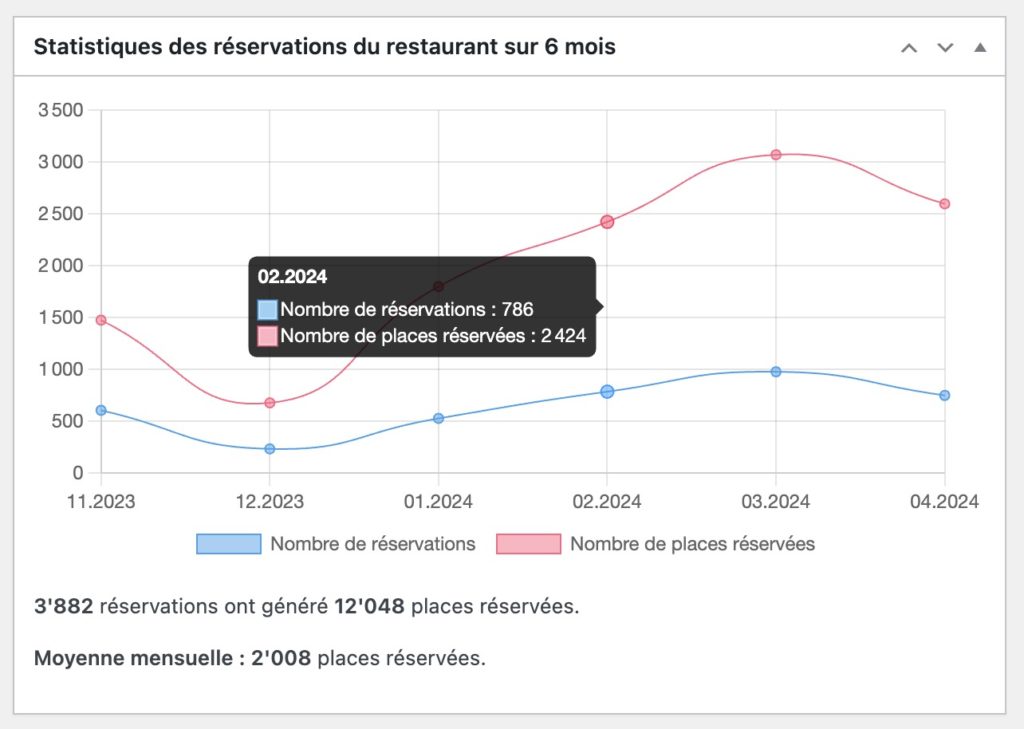
Chart.js Exemple